Monday, December 31, 2012

2012, she's dead folks

Well the year is drawing quickly to a close, and the market has tossed in the towel early.  Marko Juras reports VREB numbers from this morning as follows:

December 2012 month to date
Net Unconditional Sales: 278 (254, 186, 112)
New Listings: 399 (374, 294, 179)
Active Listings:  3894 (3979, 4118, 4215)
Sales to new listings ratio: 70% (68%, 63%, 63%)

December 2011
Net Unconditional Sales: 339
New Listings: 505
Active Listings: 3780
Sales to new listings ratio: 67%
Sales to active listings ratio: 9% or 11.2 MOI

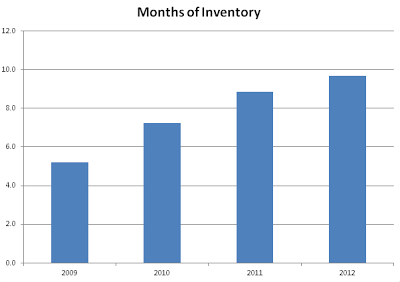
The number of deals closed today is likely under 10, so expect the month to wheeze to a close with less than 290 sales, or almost 15% under last year's already terrible sales rate.  Listings have slowed similarly, with a sales/list at just over last year's number.  Here's a quick recap of the last three years to show how the market has weakened.


Interestingly enough, the sales/list ratio this year was identical to last year, but the inventory and MOI continued to climb significantly.  Less people taking their properties off market hoping for better days ahead and more people hanging on for that eventual sale.

Monday, December 24, 2012

Holiday Market Update


MLS stats update courtesy of the VREB via Marko Juras. These numbers are for the Victoria Real Estate Board's reporting area, including Sooke, Shawnigan Lake and the Gulf Islands.

December 2012 month to date
Net Unconditional Sales: 254 (186, 112)
New Listings: 374 (294, 179)
Active Listings:  3979 (4118, 4215)
Sales to new listings ratio: 68% (63%, 63%)

December 2011
Net Unconditional Sales: 339
New Listings: 505
Active Listings: 3780
Sales to new listings ratio: 67%
Sales to active listings ratio: 9% or 11.2 MOI

Tracking very close to last year's numbers now, we should be pretty much bang on for sales with possibly somewhat higher inventory.  

Happy holidays everyone!  Thanks to everyone for making this blog so active and interesting.

Monday, December 17, 2012

Dec 17 Monday Market Update

MLS numbers update courtesy of the VREB via Marko Juras. These numbers are for the Victoria Real Estate Board's reporting area, including Sooke, Shawnigan Lake and the Gulf Islands.

December 2012 month to date
Net Unconditional Sales: 186 (112)
New Listings: 294 (179)
Active Listings:  4118 (4215)
Sales to new listings ratio: 63% (63%)

December 2011
Net Unconditional Sales: 339
New Listings: 505
Active Listings: 3780
Sales to new listings ratio: 67%
Sales to active listings ratio: 9% or 11.2 MOI

Sales dropped off rapidly as predicted.  At the current rate we're going to end up in about the same situation as previous months, significantly slower than last year while listings stay higher.  Not much else to say about that!

Sale price / assessed value for the higher end has taken a bit of a dip lately.  This ratio was always significantly higher for the more expensive properties, hovering around 100% this year while the lower end has been below 95% for months (currently 91.5%).  As the good stuff is sold, the remaining crap is picked up in the slow months for lower relative to assessed.


Thursday, December 13, 2012

Debt Update

Who would have thought this slow market would be so exciting to generate over a 100 comments a day?  Time for a new post so we can all save ourselves a click.  Just please keep it civil.  If you want to insult other commenters then please post on vancouvercondo.info instead where at least you can be voted down.

In the news, Canadians continue to pile on the debt, now at 164.6% of income, rising from 163.3% in the previous quarter.

Meanwhile in BC, Moody's has downgraded our credit outlook to negative, while it becomes increasingly obvious that the budget is nowhere near on track to be balanced.  In the article the loss of revenue is attributed to lower natural resource royalties.  As the housing market slows down, the loss from FIRE and construction industries will be another big bite.

Contruction + FIRE industries as percent of BC's total GDP - From theeconomicanalyst.com

Monday, December 10, 2012

Christmas Shopping Early and the Danger of Metrics

First an update on the MLS numbers courtesy of the VREB via Marko Juras. These numbers are for the Victoria Real Estate Board's reporting area, including Sooke, Shawnigan Lake and the Gulf Islands.

December 2012 month to date
Net Unconditional Sales: 112
New Listings: 179
Active Listings:  4215
Sales to new listings ratio: 63%

December 2011
Net Unconditional Sales: 339
New Listings: 505
Active Listings: 3780
Sales to new listings ratio: 67%
Sales to active listings ratio: 9% or 11.2 MOI

A boost in sales in the first week of the month indicates Victorians are getting their Christmas house shopping done early, although we are still at a lower sales/list than last year.  Expect sales to deteriorate quickly as the season gets into full swing.  This is the month where most listings fall off the board so it will be interesting to see where we're at come the new year.

There's been some great lively discussion today about different metrics and how they compare to other cities or to long term averages.  I wanted to add my 2 cents to interpreting these measures, and since it's market update time I'm going to abuse my posting privileges to prosthelytize my opinions from up here.

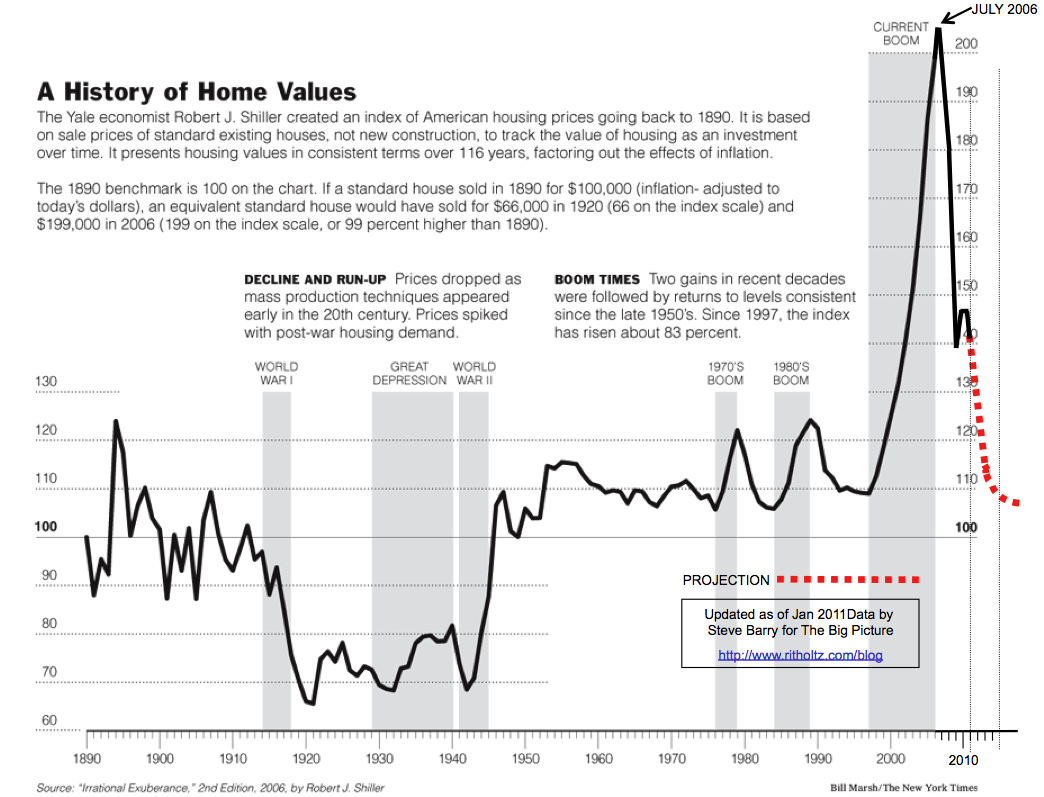
One of the common graphs that are used when talking about a long term trend for real estate is the Case Shiller 100 year history of home prices in the US.   It's only up to the end of 2010 so prices have declined somewhat since the end of that graph.  However it also seems increasingly clear that prices are now on the rebound in the US.  I suspect the rebound will moderate, but I don't think anyone believes that prices will deteriorate another 30-40% to achieve that long term mean from 1945 to shortly before 2000.

To me this underscores the importance of interest rates and availability of credit, and any metric that doesn't take this into account will not be a very accurate predictor of overvaluation in the market.

Price to rent and price to income are used extensively because they are simple metrics and easy to calculate, but again it ignores the price of credit.  If someone is grossing $60,000 and paying 8% on a mortgage, using CMHC's guideline GDS ratio they could afford a house of about $210,000, or a sensible 3.5 times income.
Now we've got that same individual paying 3% for a mortgage, and suddenly they can afford a $335,000 house which works out to a concerning 5.6 times income.

So what actually changed?  Well savers get punished in the second scenario as pre-payments are much less effective at reducing those interest costs.  Also the second borrower is at a higher risk because there is more room for interest rates to increase.  However overall default risk is likely quite similar.  Price to income (and similarly price to rent) paints a somewhat misleading picture in these situations.

Even what seems to be an apples to apples comparison like price/income between cities is more complex than it seems.  One obvious problem is differences in the ownership rate, especially when you start comparing Victoria to cities we know nothing about.  A place might have a high price to income ratio, but if their ownership rate is not substantially similar to Victoria then the numbers are not comparable.

The multitude of studies out there pointing at either massive overvaluation or perfectly normal prices illustrate how little consensus there really is.  Sites like Zillow and Numbeo should be taken with a huge grain of salt given their partially croud-sourced nature.  In fact any study or comparison should be questioned to matter how impressive the name behind it may be.   If the data is not sourced you might as well ignore it.

Tuesday, December 4, 2012

This and that

Top of the this list--some thank you's.

Thank you to Leo S for keeping up with posts lately, especially the market update posts we keep coming for each week.

Thank you to Marko Juras for bucking the trend of agents pretending this blog doesn't exist and providing us with the most up to date market data in as close to real time as practical.

Thank you to Ben Rabidoux, for the shout out calling this blog "solid." For a guy who turned academia and blogging into what I hope is a lucrative private sector gig, that's a solid shout out. Word. Appreciated.

And finally, thank you to the commentators, because you're the reason why anyone would ever call this blog solid.

And now on to that commentary...

The market in Victoria is the pits. Even if the valuation numbers aren't showing it yet. On a personal note, I have mixed feelings. Having written about the market as long as I have, I would have expected more feelings of schadenfreude over the coming months. I don't. And I very likely won't.

Since leaving town for sunnier pastures, though arguably slightly, and only so very slightly, colder, I've become detached, let's call me an objective, no longer emotional, observer. The Victoria market is far less interesting as a result. Dare I call it boring. The only real attachment I have to it now is the experience of others.

I have a close relative who tried, unsuccessfully, to sell an over priced house in the summer before leaving town for the winter. I laughed out loud when they told me they were pulling it off the market for the winter to try again in the spring--only because they blamed the slow fall market for the lack of showings and not their 25% premium to the current market state asking price.

I have another friend who's joined me in my new city with family in tow for a new employment opportunity, leaving an unsold property temporarily rented out behind because, again, no offers due to unrealistic selling price expectations... I hold the agent partly responsible for suggesting the slow market, and not the price, as the culprit.

Both of these folks, should they sell at today's true market value, would still walk away with a hefty sum more than they'd ever spent on their home regardless. Some could call it greed. I simply call it market ignorance.

Another friend sold their house. Not without complications. And not without compromising on their price expectations. But sold it they did and they couldn't be happier. They'll be leaving town too come spring.  

Intertwined with the current market state, two other folks close to me make their living working on homes. Turns out few are spending money making improvements these days. Meanwhile the municipalities complicate matters further with fee hikes, red tape and regulations that can only be described as adding massive increases to the costs of what should be simple renovations. If I owned a trades related company in Victoria right now I'd be screaming at the newspapers to get on this story in a hurry before my business failed. Unfortunately, that screaming would most likely fall on deaf ears until businesses do fail and good people start hurting bad.

No one wants to see people hurting--no matter how many times you had to listen to them preach about their real estate winnings in the past.  

Monday, December 3, 2012

November Market Weak, Prices Flat

Another month, another slow market in Victoria.  Average and median prices jumped up, but surprisingly the VREB did not jump on this bit of good news, recognizing that increasing prices in a market with over 12 months of inventory is due more to statistical variance than demand.  The weakness has been felt more in the condo market, where the median is down 10% YoY.

So here are the highlights:
  • Sales down 24% YoY
  • Sales to new list ratio down 9% YoY
  • Months of Inventory up a whopping 37%
But prices are still sticky.  Median price is up 1% YoY.  Taking a rolling average we're down a percent or two but nothing to write home about.  As Just Jack said, we won't truly know where the market is until the spring when sales rebound and the statistics become a bit more meaningful.  Here's an update on the MOI situation.
MOI And SFH Price (Note this is residential MOI)
An astounding increase in the past few months, and if the last couple years are any indication we can expect continued high values for December and January.  Here's the full VREB story.

Saturday, December 1, 2012

CMHC stops handing out credit like candy

The heyday of free credit is most definitely over.  Over at CanadianMortgageTrends is an article proclaiming that CMHC mortgage volumes are down 37% this quarter.

The cause?  A quadruple punch from a slowing market, new regulations that stripped out some marginal borrowers, limits on refinancing, and the cessation of bulk portfolio insurance.

The bulk insurance story is particularly promising, since banks can no longer pass their risk on conventional mortgages to the taxpayer.  Now that CMHC is bumping against their $600B limit, they have essentially completely shut down the program.  CanadianMortgageTrends reports that the big banks are now operating under a strict $1B/year and small lenders are seeing an 80% reduction in the bulk insurance they have access to.  Now that the political climate has shifted from party to hangover, it is highly unlikely that CMHC's cap will be raised, and they are preparing to live under the new ceiling for the long term.

The bulk insurance racket looked good for CMHC's overall portfolio (average equity 45%), but allowed the lenders to pass off all the risk for minimal cost.  Mortgage with 25% equity but a stretched owner with shaky employment?  Pass it off to the taxpayer in a big bundle.  The "private" insurers only do limited bulk insurance, so this option is now essentially off the table in Canada.

We've seen the effects of these rules here in Victoria with sales down, MOI up, and many deals falling through.  The lower end seems to be hit hardest so far, with sale prices still exploring new lows relative to assessment.