Monday, December 31, 2012

2012, she's dead folks

Well the year is drawing quickly to a close, and the market has tossed in the towel early.  Marko Juras reports VREB numbers from this morning as follows:

December 2012 month to date
Net Unconditional Sales: 278 (254, 186, 112)
New Listings: 399 (374, 294, 179)
Active Listings:  3894 (3979, 4118, 4215)
Sales to new listings ratio: 70% (68%, 63%, 63%)

December 2011
Net Unconditional Sales: 339
New Listings: 505
Active Listings: 3780
Sales to new listings ratio: 67%
Sales to active listings ratio: 9% or 11.2 MOI

The number of deals closed today is likely under 10, so expect the month to wheeze to a close with less than 290 sales, or almost 15% under last year's already terrible sales rate.  Listings have slowed similarly, with a sales/list at just over last year's number.  Here's a quick recap of the last three years to show how the market has weakened.


Interestingly enough, the sales/list ratio this year was identical to last year, but the inventory and MOI continued to climb significantly.  Less people taking their properties off market hoping for better days ahead and more people hanging on for that eventual sale.

Monday, December 24, 2012

Holiday Market Update


MLS stats update courtesy of the VREB via Marko Juras. These numbers are for the Victoria Real Estate Board's reporting area, including Sooke, Shawnigan Lake and the Gulf Islands.

December 2012 month to date
Net Unconditional Sales: 254 (186, 112)
New Listings: 374 (294, 179)
Active Listings:  3979 (4118, 4215)
Sales to new listings ratio: 68% (63%, 63%)

December 2011
Net Unconditional Sales: 339
New Listings: 505
Active Listings: 3780
Sales to new listings ratio: 67%
Sales to active listings ratio: 9% or 11.2 MOI

Tracking very close to last year's numbers now, we should be pretty much bang on for sales with possibly somewhat higher inventory.  

Happy holidays everyone!  Thanks to everyone for making this blog so active and interesting.

Monday, December 17, 2012

Dec 17 Monday Market Update

MLS numbers update courtesy of the VREB via Marko Juras. These numbers are for the Victoria Real Estate Board's reporting area, including Sooke, Shawnigan Lake and the Gulf Islands.

December 2012 month to date
Net Unconditional Sales: 186 (112)
New Listings: 294 (179)
Active Listings:  4118 (4215)
Sales to new listings ratio: 63% (63%)

December 2011
Net Unconditional Sales: 339
New Listings: 505
Active Listings: 3780
Sales to new listings ratio: 67%
Sales to active listings ratio: 9% or 11.2 MOI

Sales dropped off rapidly as predicted.  At the current rate we're going to end up in about the same situation as previous months, significantly slower than last year while listings stay higher.  Not much else to say about that!

Sale price / assessed value for the higher end has taken a bit of a dip lately.  This ratio was always significantly higher for the more expensive properties, hovering around 100% this year while the lower end has been below 95% for months (currently 91.5%).  As the good stuff is sold, the remaining crap is picked up in the slow months for lower relative to assessed.


Thursday, December 13, 2012

Debt Update

Who would have thought this slow market would be so exciting to generate over a 100 comments a day?  Time for a new post so we can all save ourselves a click.  Just please keep it civil.  If you want to insult other commenters then please post on vancouvercondo.info instead where at least you can be voted down.

In the news, Canadians continue to pile on the debt, now at 164.6% of income, rising from 163.3% in the previous quarter.

Meanwhile in BC, Moody's has downgraded our credit outlook to negative, while it becomes increasingly obvious that the budget is nowhere near on track to be balanced.  In the article the loss of revenue is attributed to lower natural resource royalties.  As the housing market slows down, the loss from FIRE and construction industries will be another big bite.

Contruction + FIRE industries as percent of BC's total GDP - From theeconomicanalyst.com

Monday, December 10, 2012

Christmas Shopping Early and the Danger of Metrics

First an update on the MLS numbers courtesy of the VREB via Marko Juras. These numbers are for the Victoria Real Estate Board's reporting area, including Sooke, Shawnigan Lake and the Gulf Islands.

December 2012 month to date
Net Unconditional Sales: 112
New Listings: 179
Active Listings:  4215
Sales to new listings ratio: 63%

December 2011
Net Unconditional Sales: 339
New Listings: 505
Active Listings: 3780
Sales to new listings ratio: 67%
Sales to active listings ratio: 9% or 11.2 MOI

A boost in sales in the first week of the month indicates Victorians are getting their Christmas house shopping done early, although we are still at a lower sales/list than last year.  Expect sales to deteriorate quickly as the season gets into full swing.  This is the month where most listings fall off the board so it will be interesting to see where we're at come the new year.

There's been some great lively discussion today about different metrics and how they compare to other cities or to long term averages.  I wanted to add my 2 cents to interpreting these measures, and since it's market update time I'm going to abuse my posting privileges to prosthelytize my opinions from up here.

One of the common graphs that are used when talking about a long term trend for real estate is the Case Shiller 100 year history of home prices in the US.   It's only up to the end of 2010 so prices have declined somewhat since the end of that graph.  However it also seems increasingly clear that prices are now on the rebound in the US.  I suspect the rebound will moderate, but I don't think anyone believes that prices will deteriorate another 30-40% to achieve that long term mean from 1945 to shortly before 2000.

To me this underscores the importance of interest rates and availability of credit, and any metric that doesn't take this into account will not be a very accurate predictor of overvaluation in the market.

Price to rent and price to income are used extensively because they are simple metrics and easy to calculate, but again it ignores the price of credit.  If someone is grossing $60,000 and paying 8% on a mortgage, using CMHC's guideline GDS ratio they could afford a house of about $210,000, or a sensible 3.5 times income.
Now we've got that same individual paying 3% for a mortgage, and suddenly they can afford a $335,000 house which works out to a concerning 5.6 times income.

So what actually changed?  Well savers get punished in the second scenario as pre-payments are much less effective at reducing those interest costs.  Also the second borrower is at a higher risk because there is more room for interest rates to increase.  However overall default risk is likely quite similar.  Price to income (and similarly price to rent) paints a somewhat misleading picture in these situations.

Even what seems to be an apples to apples comparison like price/income between cities is more complex than it seems.  One obvious problem is differences in the ownership rate, especially when you start comparing Victoria to cities we know nothing about.  A place might have a high price to income ratio, but if their ownership rate is not substantially similar to Victoria then the numbers are not comparable.

The multitude of studies out there pointing at either massive overvaluation or perfectly normal prices illustrate how little consensus there really is.  Sites like Zillow and Numbeo should be taken with a huge grain of salt given their partially croud-sourced nature.  In fact any study or comparison should be questioned to matter how impressive the name behind it may be.   If the data is not sourced you might as well ignore it.

Tuesday, December 4, 2012

This and that

Top of the this list--some thank you's.

Thank you to Leo S for keeping up with posts lately, especially the market update posts we keep coming for each week.

Thank you to Marko Juras for bucking the trend of agents pretending this blog doesn't exist and providing us with the most up to date market data in as close to real time as practical.

Thank you to Ben Rabidoux, for the shout out calling this blog "solid." For a guy who turned academia and blogging into what I hope is a lucrative private sector gig, that's a solid shout out. Word. Appreciated.

And finally, thank you to the commentators, because you're the reason why anyone would ever call this blog solid.

And now on to that commentary...

The market in Victoria is the pits. Even if the valuation numbers aren't showing it yet. On a personal note, I have mixed feelings. Having written about the market as long as I have, I would have expected more feelings of schadenfreude over the coming months. I don't. And I very likely won't.

Since leaving town for sunnier pastures, though arguably slightly, and only so very slightly, colder, I've become detached, let's call me an objective, no longer emotional, observer. The Victoria market is far less interesting as a result. Dare I call it boring. The only real attachment I have to it now is the experience of others.

I have a close relative who tried, unsuccessfully, to sell an over priced house in the summer before leaving town for the winter. I laughed out loud when they told me they were pulling it off the market for the winter to try again in the spring--only because they blamed the slow fall market for the lack of showings and not their 25% premium to the current market state asking price.

I have another friend who's joined me in my new city with family in tow for a new employment opportunity, leaving an unsold property temporarily rented out behind because, again, no offers due to unrealistic selling price expectations... I hold the agent partly responsible for suggesting the slow market, and not the price, as the culprit.

Both of these folks, should they sell at today's true market value, would still walk away with a hefty sum more than they'd ever spent on their home regardless. Some could call it greed. I simply call it market ignorance.

Another friend sold their house. Not without complications. And not without compromising on their price expectations. But sold it they did and they couldn't be happier. They'll be leaving town too come spring.  

Intertwined with the current market state, two other folks close to me make their living working on homes. Turns out few are spending money making improvements these days. Meanwhile the municipalities complicate matters further with fee hikes, red tape and regulations that can only be described as adding massive increases to the costs of what should be simple renovations. If I owned a trades related company in Victoria right now I'd be screaming at the newspapers to get on this story in a hurry before my business failed. Unfortunately, that screaming would most likely fall on deaf ears until businesses do fail and good people start hurting bad.

No one wants to see people hurting--no matter how many times you had to listen to them preach about their real estate winnings in the past.  

Monday, December 3, 2012

November Market Weak, Prices Flat

Another month, another slow market in Victoria.  Average and median prices jumped up, but surprisingly the VREB did not jump on this bit of good news, recognizing that increasing prices in a market with over 12 months of inventory is due more to statistical variance than demand.  The weakness has been felt more in the condo market, where the median is down 10% YoY.

So here are the highlights:
  • Sales down 24% YoY
  • Sales to new list ratio down 9% YoY
  • Months of Inventory up a whopping 37%
But prices are still sticky.  Median price is up 1% YoY.  Taking a rolling average we're down a percent or two but nothing to write home about.  As Just Jack said, we won't truly know where the market is until the spring when sales rebound and the statistics become a bit more meaningful.  Here's an update on the MOI situation.
MOI And SFH Price (Note this is residential MOI)
An astounding increase in the past few months, and if the last couple years are any indication we can expect continued high values for December and January.  Here's the full VREB story.

Saturday, December 1, 2012

CMHC stops handing out credit like candy

The heyday of free credit is most definitely over.  Over at CanadianMortgageTrends is an article proclaiming that CMHC mortgage volumes are down 37% this quarter.

The cause?  A quadruple punch from a slowing market, new regulations that stripped out some marginal borrowers, limits on refinancing, and the cessation of bulk portfolio insurance.

The bulk insurance story is particularly promising, since banks can no longer pass their risk on conventional mortgages to the taxpayer.  Now that CMHC is bumping against their $600B limit, they have essentially completely shut down the program.  CanadianMortgageTrends reports that the big banks are now operating under a strict $1B/year and small lenders are seeing an 80% reduction in the bulk insurance they have access to.  Now that the political climate has shifted from party to hangover, it is highly unlikely that CMHC's cap will be raised, and they are preparing to live under the new ceiling for the long term.

The bulk insurance racket looked good for CMHC's overall portfolio (average equity 45%), but allowed the lenders to pass off all the risk for minimal cost.  Mortgage with 25% equity but a stretched owner with shaky employment?  Pass it off to the taxpayer in a big bundle.  The "private" insurers only do limited bulk insurance, so this option is now essentially off the table in Canada.

We've seen the effects of these rules here in Victoria with sales down, MOI up, and many deals falling through.  The lower end seems to be hit hardest so far, with sale prices still exploring new lows relative to assessment.


Monday, November 26, 2012

Nov 26, Monday Market Update

MLS numbers courtesy of the VREB via Marko Juras. These numbers are for the Victoria Real Estate Board's reporting area, including Sooke, Shawnigan Lake and the Gulf Islands.


November 2012 month to date
Net Unconditional Sales: 289 (210, 140, 40)
New Listings: 594 (451, 323, 116)
Active Listings:  4525 (4577, 4648, 4397)
Sales to new listings ratio: 49% (47%, 43%, 34%)

November 2011
Net Unconditional Sales: 482
New Listings: 847
Active Listings: 4329
Sales to new listings ratio: 57%
Sales to active listings ratio: 11% or 9 MOI

Not much to say about that.  Sales are down significantly YoY, while listings are almost on pace.  I'm thinking north of 11 MOI for the month.

The mortgage industry continues to hyperventilate about the rules and cry government interference in a market that only exists because of said interference.  Luckily some cooler heads are out there, including CIBC's Benjamin Tal, and suprisingly, the head of Royal LePage, who said
“I’m being contrary again. I think the impact of mortgage regulation is being blamed far too often these days in what is clearly just a natural cyclical slowdown in the market driven by overpriced homes. We were due for a slowdown. The timing was unfortunate but it’s not a major event. I think chances of it (the regulations) being reversed are close to zero.”
In other news, the Bank of England poached Mark Carney.   I wonder what this means for the Bank of Canada's rate position.. 

Monday, November 19, 2012

Nov 19 Monday Market Update


MLS numbers courtesy of the VREB via Marko Juras. These numbers are for the Victoria Real Estate Board's reporting area, including Sooke, Shawnigan Lake and the Gulf Islands.

November 2012 month to date
Net Unconditional Sales: 210 (140, 40)
New Listings: 451 (323, 116)
Active Listings:  4577 (4648, 4397)
Sales to new listings ratio: 47% (43%, 34%)

November 2011
Net Unconditional Sales: 482
New Listings: 847
Active Listings: 4329
Sales to new listings ratio: 57%
Sales to active listings ratio: 11% or 9 MOI

Just over halfway through the business days of the month and we're on-track for about 400 sales, or continued sluggishness.

Meanwhile, the wailing and teeth gnashing about the new mortgage rules continues amongst those that stand to lose from them.  Some interesting tidbits from that article:
“…Simulations indicate that on average (based on 2010 real mortgage data), the additional down payment required is about $25,000, 7% of the purchase price.....  If we assume that these households can devote 10% of their pre-tax incomes to enlarging their down payments, on average it will take 3.5 years to re-qualify"
Looks like this time the hit is larger, and those people knocked to the sidelines will take quite a long time to recover.  This is all keeping in mind that this is under best case conditions of continued low interest rates and an optimistic savings rate.  

Tuesday, November 13, 2012

Nov 13 Weekly Market Update

MLS numbers courtesy of the VREB via Marko Juras. These numbers are for the Victoria Real Estate Board's reporting area, including Sooke, Shawnigan Lake and the Gulf Islands.

November 2012 month to date
Net Unconditional Sales: 140 (40)
New Listings: 323 (116)
Active Listings:  4648 (4397)
Sales to new listings ratio: 43% (34%)

November 2011
Net Unconditional Sales: 482
New Listings: 847
Active Listings: 4329
Sales to new listings ratio: 57%
Sales to active listings ratio: 11% or 9 MOI

Big jump in active listings from last week.  Not sure how that works exactly, since last week there were 207 new listings added to 4397 active listings which adds up to 4604.  And yet we have 4648?  Some BOMs would add to that number, but what about all the properties that went off market in the last week?

We're on track for 350-420 sales this month depending on how you project.  Another month of sky high MOI for sure.

Monday, November 5, 2012

Monday market update: don't wait till spring to sell

This week's VREB Monday numbers thanks to Marko Juras. These numbers are for the Victoria Real Estate Board's reporting area, including Sooke, Shawnigan Lake and the Gulf Islands.


November 2012 month to date
Net Unconditional Sales: 40 
New Listings: 116 
Active Listings: 4397
Sales to new listings ratio: 34% 

November 2011
Net Unconditional Sales: 482
New Listings: 847
Active Listings: 4329
Sales to new listings ratio: 57%
Sales to active listings ratio: 11% or 9.0 MOI

Canada braces as housing slowdown takes hold (h/t koozdra)


That's about as bold a headline as we've seen in some time. 

These quotes are just gold, especially coming from a local agent:

"Personally I don't see any revitalization of the market in the near future" - investors have left the market

“Sellers will commonly say, ’I’m going to wait until the spring, when the market is better.’ And I warn them that it could be worse... And of course buyers are saying ’It looks like things are bad, I’m going to hold off until the market drops another 10 or 20%.”’

When was the last time you heard an agent use the pronoun another in relation to a significant market drop? 

I know, I know, there's more than a few folks out there telling themselves they don't have to sell so they don't have to accept a lower price. Fair enough.

But remember: it's the homes that sell that set the market value of the homes that don't. 

Victorian's got away with a temporary drop in 2008/09. Me thinks this time it's different. 

Thursday, November 1, 2012

October Market - Spooky Scary

Another month, another deterioration in market conditions in Victoria.  It's so boring out there that we were reduced to arguing about Alberta for the week.

From our previous year of inventory, we have advanced even further to 13.1 MOI for the entire region. The only other time in VREB recorded history that we've had higher MOI was in fall of 2008 when everyone was convinced that we were heading into another great depression.  That October our MOI was 14.8 and prices were dropping.

Of course this is for the overall market, and Just Jack quite rightly points out that the MOI varies significantly between regions.  Especially for single family houses in the core, the MOI is still within the range of a balanced market.

Victoria City - 7.2
Oak Bay - 6.0
Esquimalt - 7.2
View Royal - 9.0
Saanich East - 5.9
Saanich West - 5.7
The VREB has placed the blame for the slowdown firmly in the lap of the feds, which is certainly an improvement over blaming the weather.  If true, we should see sales recover around Jan to April as the market adjusts.

Both the VREB and Just Jack show us how even hard facts aren't quite as facty as one would expect.  Reported sales for the month don't seem to line up to actual sales from the 1st to the 31st, and the VREB shows us that the average price for 6 manufactured sales is apparently negative $122,417*.  Another reason never to pay attention to single months numbers.

*Negative result reflects a collapsed sale of $1,545,000 reported as complete in Sept 2012 - VREB

Tuesday, October 30, 2012

Market data update


This week's VREB Monday numbers thanks to Marko Juras. These numbers are for the Victoria Real Estate Board's reporting area, including Sooke, Shawnigan Lake and the Gulf Islands.

October 2012 month to date (previous weeks in brackets)  
Net Unconditional Sales: 329 {242} [166] (106)
New Listings: 932 {714} [483] (276)
Active Listings: 4640 {4622} [4616] (4565)
Sales to new listings ratio: 35% {34%} [34%] (38%)

October 2011
Net Unconditional Sales: 483
New Listings: 1086
Active Listings: 4687
Sales to new listings ratio: 44%
Sales to active listings ratio: 10.3% or 9.7 MOI

The VREB will be tough pressed to produce 400 sales for the month of October... but I have faith they can work magic with numbers and pull it off!

Speaking of magicians, apparently CIBC says there's no chance of anything other than a soft landing for Canadian real estate. At least they're not still telling us prices are headed up next year. I always get a kick out of predictions from CIBC, what they being the experts who leveraged their investors earnings up the wazoo in subprime lending in the US and all--oh yeah, their chief "economist" also famously stated we were headed for $200 oil back then too!--great comic relief from the mundane market those thinkers at CIBC.... 

Monday, October 22, 2012

Monday market update: steadily slow


This week's VREB Monday numbers thanks to Marko Juras. These numbers are for the Victoria Real Estate Board's reporting area, including Sooke, Shawnigan Lake and the Gulf Islands.

October 2012 month to date (previous weeks in brackets)  
Net Unconditional Sales: 242 [166] (106)
New Listings: 714 [483] (276)
Active Listings: 4622 [4616] (4565)
Sales to new listings ratio: 34% [34%] (38%)

October 2011
Net Unconditional Sales: 483
New Listings: 1086
Active Listings: 4687
Sales to new listings ratio: 44%
Sales to active listings ratio: 10.3% or 9.7 MOI

These are challenging times to be trying to sell a house. That's all I have to say about that.

Saturday, October 20, 2012

What bottoms look like.

Well it's 200 comment time again...

But first, kudos to new poster lolatengo for pointing out that the sales/new listings ratio was incorrectly stated in the last update.  The sales/new list in the second week dropped from 38% to 34%.  This is actually highly unusual, since sales/new listings generally starts off low and increases throughout the month (since the beginning of the month brings a flood of relists).  Have we ever had a decrease from the first to second week of a month?

Back to market bottoms.  After almost buying a house a few weeks back (had an accepted offer), we've changed our minds and decided to move and rent a house for another year or so.  This is for several reasons:
  1. The houses in our price range still weren't quite what we would want to live in for the long term (15+ years).  
  2. Hard to swallow dropping half a million on a place and still needing to spend tens of thousands on repairs with the associated disruption/stress.
  3. Market is increasingly weak, so the chances of it being advantageous to wait are high.  According to Roger's rent vs buy calculator, if it stays flat, we break approximately even and can afford a better place in a year.  If it declines we save whatever the decline was.
Of course one thing to consider is how long the correction will last.  A common argument is that timing the market is impossible, and if you wait too long you'll miss the chance and have to buy when the market is recovering and competition is fierce.   

So what about past corrections?
  • 90s - 5.5 years from peak to trough, during which time conditions were favourable for buyers with lots of selection.  It took 7.5 years for nominal prices to regain their previous peak.   
  • 80s - The decline was cliff-like and lasted 4 years.  Again it took 7 years for nominal prices to regain their peak (11 until real prices caught up!).  
  • 70s - 4 year peak to trough until the bubble of the 80s started.
Our peak was in early 2010, so I think we can safely assume that our correction has at least 2 more years, and likely more after that.  I'm not worried about missing the boat anytime soon.  (By the way, for those who like to look at prices as flat since mid 2007, and thus would define our correction as already 5 years old, by that measure the 90s correction was over 8 years long).

As for timing the exact bottom, it certainly doesn't seem like there the MOI will give us any sort of predictable head's up.  When the market decides to recover, MOI falls off a cliff and prices start rising.
Victoria MOI and SFH Median for 90s market bottom (click to enlarge)
King County (Seattle) MOI and SFH Median for their market bottom
It is likely much more useful to look at affordability measures to gauge approximately how much longer a correction will continue for.  

Extra graph:  Sales to new listings ratio from 1990 to 2012.  Note that in the last 2 years we've seen the lowest sustained sales/new listings ratio in 20 years.  Crazy extrapolation:  More people than ever are listing but not able to sell.  We're building up pent up selling demand.


Monday, October 15, 2012

Flat like a halibut, or hairy like a bear?

Continuing the investigation of months of inventory, let's look at the situation before the boom.
We all know that the correction of the second half of the 90s was the kind that the government is trying to orchestrate right now: a soft landing where prices declined a little, but then just stayed flat until incomes caught up.

Generally the debate on this blog is between market bulls and bears, but I believe Dasmo coined the term halibut for those that think we are in for another flat market like the 90s.  So let's look at the situation at that time and see how it compares to today.

SFH Median and Residential MOI for Greater Victoria 1996-2012 (click to enlarge)


The average MOI from 1996 (the earliest available active listing data) to the end of 2000 was 7.3 and prices were appropriately fishy.  If we look at the last two years, we see an average MOI of 8.1 or about 10% higher than in the 90s.  Sure enough in that time we've seen some gentle declines.  The current inventory is certainly quite extraordinary.  If we continue to see YoY increases in MOI we will start to see the market slide faster.

In other news here are the latest VREB Monday numbers thanks to Marko Juras. These numbers are for the Victoria Real Estate Board's reporting area, including Sooke, Shawnigan Lake and the Gulf Islands.


October 2012 month to date (previous weeks in brackets)  
Net Unconditional Sales: 166 (106)
New Listings: 483 (276)
Active Listings:  4616 (4565)
Sales to new listings ratio: 34% (38%)

October 2011
Net Unconditional Sales: 483
New Listings: 1086
Active Listings: 4687
Sales to new listings ratio: 44%
Sales to active listings ratio: 10.3% or 9.7 MOI

Sunday, October 14, 2012

Months of Inventory Where Art Thou

One of the best measures of current demand out there is the months of inventory (MOI). This expresses the number of months it would take to sell all active listings at the current monthly sales rate.  So in September we had 419 sales with 5025 active listings, giving a MOI of 5025/419 = 12 months.

What does the MOI mean for prices?  I'll let this realtor from Phoenix explain:
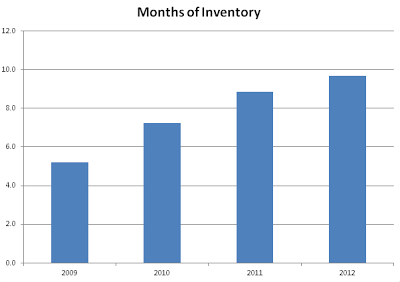
It’s widely agreed that when inventory levels fall between 5 & 7 months, that the market will be considered balanced.  Housing prices should be stable, perhaps rising slightly, influenced more by inflation than by demand.  When inventory levels exceed 7 months, then the demand for housing is low, and prices are likely to fall.  The high number of homes for sale will create a buyer’s market, allowing buyer’s to dictate price and terms to the majority of sellers if a seller wants to make a deal.  When inventory levels fall below 5 months, sellers have more control over price and terms, often resulting in a more significant rise in housing prices, aka a seller’s market.
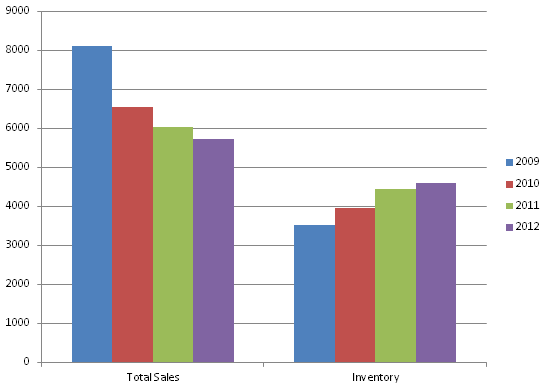
So let's take a look at the last 7 years in Victoria history.  Note that months of inventory is for all residential properties in greater Victoria, including single family homes, condominiums, townhouses, and manufactured homes. Previously I only had monthly data back to mid 2008, but Marko Juras has kindly provided monthly price, new listings, and sales data going back to 1990.  Huge thanks for that!

Victoria Residential MOI and SFH Price (click to enlarge)


Another way to look at the same data is by time.  Clearly during the boom times we were in a sellers market with months of inventory going as low as 2 and prices increasing by double digits.  HouseHuntVictoria was founded just as Victoria's market first briefly strayed into balanced territory (Feb 2007, not marked as green) however the boom wasn't done yet, and went on for another year.  Fall of 2008 brought the financial crisis and MOI went through the roof causing prices to drop steeply.  However the government crashed interest rates and let loose the lending taps to bring the market back to sellers and prices to recover.  Since 2010 we've been in a buyers market with a gentle decline in prices.


What will happen next?  It's anyone's guess but notice the steep rise in MOI in the past few months.  We are now at the highest level since the financial crisis.  Of course the fall will bring some declines here, so another way to look at it is by factoring out seasonal variations and examining the 12 month rolling average of both price and MOI.


Next up:  What does a market bottom look like?  Can it be predicted by the MOI?

UPDATE:  How odd is 12 months of inventory in September?   Very odd.


Wednesday, October 10, 2012

Wednesday's Tuesday Monday Market Update


MLS numbers courtesy of the VREB via Marko Juras. These numbers are for the Victoria Real Estate Board's reporting area, including Sooke, Shawnigan Lake and the Gulf Islands.

October 2012 month to yesterday  
Net Unconditional Sales: 106
New Listings: 276
Active Listings:  4565
Sales to new listings ratio: 38%

October 2011
Net Unconditional Sales: 483
New Listings: 1086
Active Listings: 4687
Sales to new listings ratio: 44%
Sales to active listings ratio: 10.3% or 9.7 MOI

Sales to new listings generally starts low and increases throughout the month, as most of the expired listings are posted again in the first week.   October is generally the month that inventory starts to seriously drop for the winter, so it will be interesting to see how the MOI looks at the end of the month.

It seems the VREB took my hint of blaming the weather for the slow sales.  Well I saw a light drizzle come down today and there's more rain in the forecast, so I expect a big jump in sales going forward.  All those sun-burned would-be buyers are about to come out of the woodwork.

Thursday, October 4, 2012

VREB's best fail yet

"Interest rates are also holding, but should they increase by as little as 1%, that would negate a 10% drop in purchase price. People shouldn't wait for prices to drop, because we never know when interest rates will be increased to stimulate the economy." VREB 

I don't hold the outgoing Victoria Real Estate Board president accountable for the gaff in this month's market update press release even though it appeared in her voice. I know how these things work and while it's likely she approved the use of the quote it's highly unlikely she was its author. Never-the-less, it was a priceless gem that should live on in infamy so I've added it to the header of this site so we can have a little laugh every time we find ourselves visiting.


Monday, October 1, 2012

A year of inventory in Victoria

What a beautiful September we had.  So beautiful that I'm surprised the VREB didn't use it as an excuse for the miserable sales.

We had a whole 419 sales compared to last year's 458, and 5025 active listings compared to last year's 4940.  Nothing earth shattering but just more progression in the market getting weaker and weaker every month.   Expect a drop in MOI as places drop off the market quickly in October.  The last two years have seen September mark a high point in MOI.


Some interesting points to consider:

  1. Median price is the lowest in over 3 years (July 2009).
  2. Months of inventory are the highest since February 2009.
An update to the median price chart:


Thursday, September 27, 2012

Slow times at Victoria High

It's a sales-free zone out there folks.  The only hotbed of activity is the comments section of this blog where we've managed to rack up 60 comments a day this week.

Just how slow is it out there?  Well last week I saw 12 SFH sales in the core areas under $550k and 17 from there to $900k.  So far this week I'm at 3 and 5 respectively.  Some more will come of course.
From the depths of page 2 in the comments come similar reports:
I've got one sale on my main PCS in the last four days - SFH <575 core areas + Brentwood. Are others seeing the same in their PCS accounts, or are there higher end sales happening? - Animal Spirit
We might have close to 125 house sales in the core districts this month, compared to 163 for the same month in 2008. There are about 835 active house listings now.  The Western Communities had 77 home sales in September 2008 and should have around 55 this month with an inventory of 635 listings.  The Gulf Island have some 410 listings and are on track to have 25 sales this month. - Just Jack 
Made a lowball offer on a place but after a bit of back and forth we were still miles apart.  We're offering 2013 prices and they're still in 2008.  Near as makes no difference to 5000 listings out there but there really isn't much that's interesting.  The stale listings are showing up as rentals instead on craigslist.  Wonder how that vacancy rate is going to look?

Monday, September 24, 2012

Sept 24 - Monday Market Update

MLS numbers courtesy of the VREB via Marko Juras. These numbers are for the Victoria Real Estate Board's reporting area, including Sooke, Shawnigan Lake and the Gulf Islands. 
September 2012 month to date  (previous week in brackets)
Net Unconditional Sales: 321 (208, 97) 
New Listings: 939 (671, 359)
Active Listings:  4768 (4716, 4690)
Sales to new listings ratio: 34% (31%, 27%) 

September 2011
Net Unconditional Sales: 458
New Listings: 1303
Active Listings: 4940
Sales to new listings ratio: 35%
Sales to active listings ratio: 9% or 10.8 MOI

Current SFH average is $618k, with a median of $531k, while condo average is at $331k.  Marko says "The SFH MTD Median is subject to quite a bit of variability right now, it could easily swing to 520k with two sales under 515k or up to 538k with two sales above 550k."

It's remarkable how consistent the numbers are this year.  A few less sales and listings as the same month last year.  So the inventory isn't increasing anymore YOY, but the months of inventory are still significantly higher.  We're shortly before the time when many sellers give up and try their luck again in the spring, although at this point I doubt many still seriously believe a bounce is just around the corner.

Wednesday, September 19, 2012

The stubborn seller

After a near-decade of price inflation in the Victoria real estate market, you could probably forgive sellers for the hard times they must be feeling these days as the weeks go by without a sale and the days without showings outnumber the days with showings by a wider margin. Many Victoria sellers likely believe this period will pass in short order and 'the norm' will return before they start to feel the consequences of their stubborn-ness.

Those of us who have followed this market for some time know this phenomena as "catching a falling knife."

I overheard a conversation between a seller and an agent recently* that I've re-created** here for your entertainment:

Seller: It's been 45 days since we put the house up for sale and we haven't seen an offer. Why?

Agent: The market is slow all over town right now. There's lots of houses on the market and there aren't very many buyers actively looking to make a purchase. You might want to think about dropping your asking price if you want to invite an offer.

Seller: We did that 15 days ago. You told me August was slow and things would pick up in September again so we dropped our asking price by $10,000 to attract some interest. We've had two open houses and a handful of agents walk through. And yet not even a hint of an interested buyer. Our house is worth more than we're asking for it. We've invested almost $10,000 getting it ready to sell and making it the nicest house in the neighbourhood, why no buyer interest?

Agent: The market has changed. There are far more homes for sale than buyers actively looking to make offers. Believe me, I'm hearing the same thing from my other clients and I'm hearing other agents telling me their clients are all saying the same things. You have to understand, it's not just about having a nice house anymore that people can move in and enjoy right away. I know that when you bought 7 years ago, you would have faced bidding wars on houses that needed work. That's not normal. That market was too hot to be sustainable. This market is what we call balanced. Which means you have to not only have the nicest house in your area, you also have to have the best price. Right now, we're talking about you finding the best price.

Seller: So what does that mean? Are you suggesting we drop the price again? We started at $499,000 now we're at $489,000 and there are less showings than when we were at $499,000. That doesn't tell me the price is wrong.

Agent: Do you recall when we first talked about your listing price? We looked at some comparables in the neighbourhood to determine what price your house should be offered for sale at. We had a discussion then about the condition of your house in comparison to your immediate competition. We agreed the money you'd spent on getting your home ready for sale made it nicer than the rest. We agreed this was a good thing and would likely mean that you were more likely to get more for your house than Mr and Mrs Jones the next block over.

Seller: We did. We should. Our house is nicer. It's worth more.

Agent: Have any of those houses sold yet? They haven't have they? Have they dropped their prices too? They have. You see what I mean? Your house is in nicer condition and you're asking a premium price based on that when you look at the comparables. 

Seller: Of course we are. It's worth more.

Agent: I think we should price it the same as the Jone's house around the corner and see if we can invite more viewings that way and maybe entice an offer.

Seller: Are you suggesting we drop our price over $40,000 from the original? That's crazy, we may as well give it away.

Agent: If we price it the same, you'll have the best house at the same price. If you were shopping around for a new car, and saw a BMW for the same price as a Toyota, would you hesitate to look at the BMW and maybe even buy it?

Seller: We can buy a BMW with that $40,000 you're suggesting we just give away.

Agent: You're moving right? You've already made that commitment. What are your options? Can you afford to buy your new house if this one hasn't sold? Can you afford to wait to move until this house sells at the price you think it should sell for? I have to tell you, I don't see prices going up anytime soon. They haven't really been going up for a couple of years now. So if your price that you think your house should be at is already too high, when do you see the market bringing you that price? 

Seller: You tell me, you're supposed to be the expert.

Agent: I'm telling you now. The market doesn't agree that you have a $500,000 home. The market might bear $460,000, but we won't know until we try.

Seller: If we drop the price $40,000 in only 45 days we'll be inviting low ball offers. We don't want a low ball offer.

Agent: Right now you're not getting any offers. A low ball offer is better than no offer and gives us a chance to counter. Once a buyer has made a decision to make an offer, we'll have an opportunity to negotiate. That's a lot better position than you're in today. 

Seller: So we drop our price. What happens when the Jone's drop their's too, which they did already? What then? Drop our price all over again? That would be crazy. This is Victoria, people want to live here.***

Agent: That's competition and that's the way the market works. Hopefully you'll get a buyer soon. But you'll need to be prepared to adapt to the changing conditions in the market if you really want to sell your home . 
  
* no I didn't
** by re-created I mean made-up
*** see what I did there?