A couple weeks ago there was some talk about sales projections, and whether it was better to project monthly sales based on business days or days of the month. I've used business days before just because I've seen it used elsewhere, but DavidL made the point that sales will happen on any day, and it really doesn't matter whether they get entered on Sunday or Monday (unless the month ends on a weekend).
However both methods have a fundamental shortcoming which is that they assume a constant market. Both methods project the sales rate of the month to date out to the full month, which only works when the sales rate is more or less constant and there is no such thing as seasonality. This leads to chronic underestimation of sales when the market is heating up in the spring, and overestimation when it is cooling down in the fall. The projections for last month illustrate this quite well:
| Feb 2013 | Feb 2012 | ||||
| Wk 1 | Wk 2 | Wk 3 | Wk 4 | ||
| Uncond. Sales |
19
|
121
|
209
|
322 |
497
|
| New Listings |
104
|
405
|
632
|
889 |
1318
|
| Active Listings |
3786
|
3886
|
3964
|
4031 |
3977
|
| Sales to New Listings |
18%
|
30%
|
33%
|
36% |
38%
|
| Sales Projection |
--
|
338
|
344
|
376 | |
| Months of Inventory |
8.0
|
||||
The final sales for Feb 2013 came to 394. We can see that halfway through the month our simple linear projection was still off by 50 sales, or 12.6%. An attempt to make a prediction at the start of the month would have been even worse. Hence the need for a new model that tries to take into account the rate of change in the sales rate for the current month to improve the projection.
First we have to estimate how the sales rate will change from the previous month to the current one. To do this, I look at data from the previous year. For example, in Jan 2012 we had 372 sales, for a sales rate of 12 sales/day, while Feb 2012 yielded 497 or 17.1 per day. Assuming that this year will behave similarly to last year, we can use a linear approximation to estimate the sales rate on a given day.

Where y is our expected sales rate on day x, a is the slope calculated from last year's data (0.17 in this case), and b is the sales rate from Jan 2013. Now that we have an equation for how the sales rate is expected to behave, all we have to do to calculate the projected sales is integrate over the month of February. In case anyone is interested, here's the VBA code.
Using this method, the prediction for this month would have been 407 sales, or only 3% off the actual number.
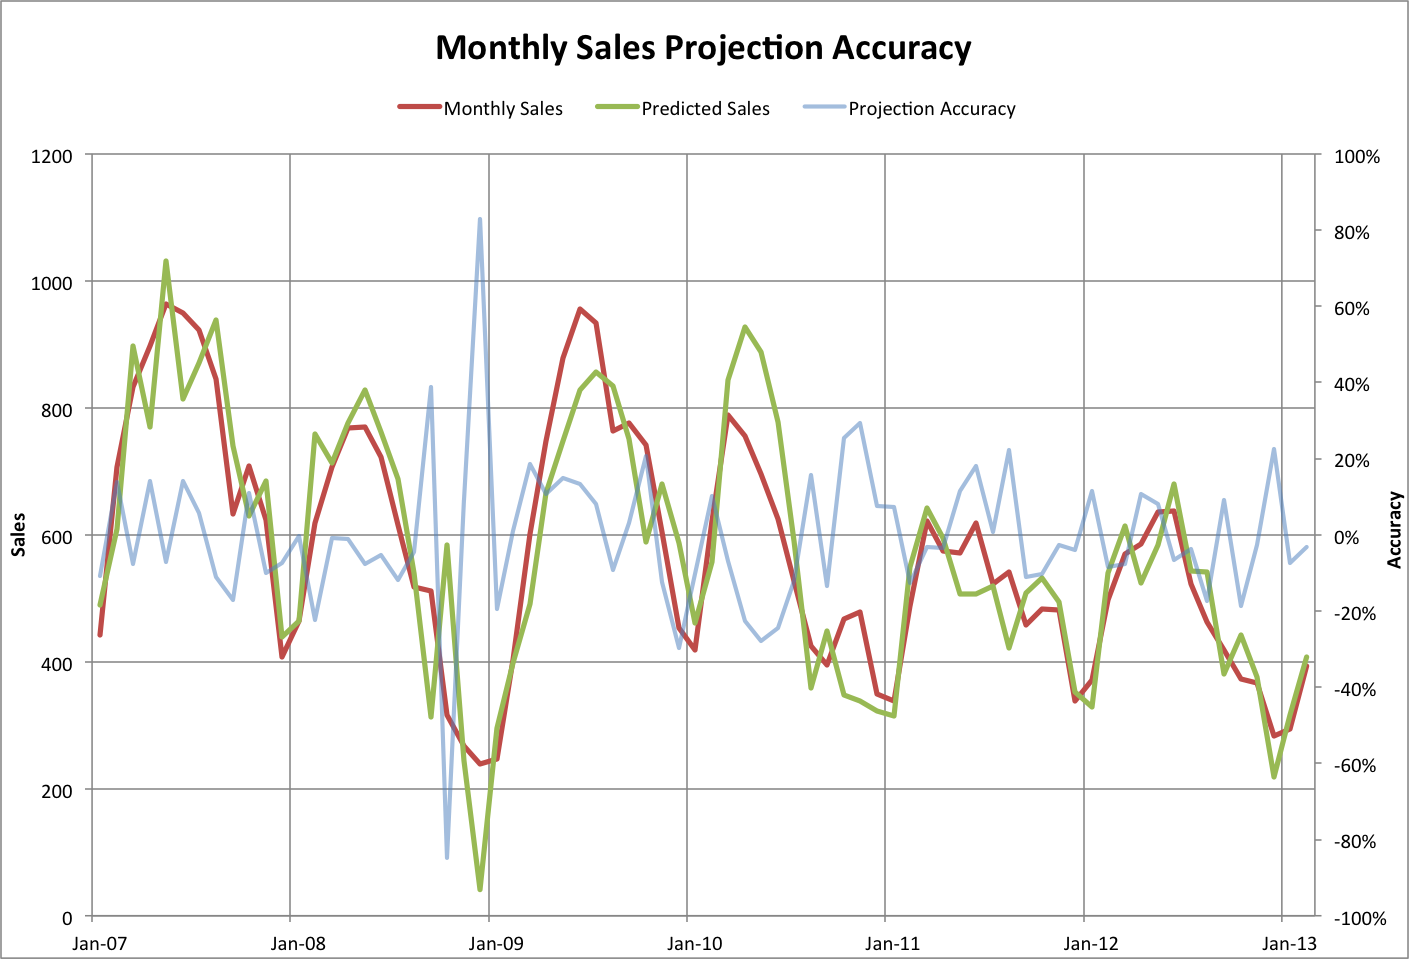
Of course the key assumption is that the market will behave similarly to last year's. This happens to have worked out well for February 2013, but can work out quite spectacularly badly during times when the market is shifting. Let's have a look at the accuracy of the predictions using this method over the last few years.
So, how many sales can we expect this month? Computer says 474.
206 comments:
«Oldest ‹Older 201 – 206 of 206DavidL,
Take a look at the older condos that haven't been updated. Even in choice locations around Cook Street Village they're tanking big time.
Restrictions on age and rentals means there is no foreseeable bottom to the prices.
You're too young to live in it - or have young kids and you can't rent it.
Where's bottom? Even the most ardent Bull would have a difficult time rationalizing why they would spend 200K for something that you can't live in or rent. Or even a 100K or 50K.
A CMHC scandal? Nope not me. That's for some young pup writer working for the Globe and Mail, with cages full of rabid defense lawyers.
If ya swim wit de sharks, Ya gotta be prepared to sleep wit de fishies.
Hey unlike you lot I have to work during the day! :)
But I have some ideas for new posts.
Leo, forget about your job and your new baby--your duty to the HHV blog is the most important thing!
:)
A CMHC scandal? Nope not me. That's for some young pup writer working for the Globe and Mail, with cages full of rabid defense lawyers.
They do seem to get a little testy when someone uncovers the truth.
The chart shows that a larger proportion of expensive homes are selling, while the selling price on the cheaper homes is dropping fast.
Interesting chart. Any ideas as to the reason for the divergence between the lower and higher ends of the market?
Are buyers at the upper end investing cash, fearful of inflation, while those at the lower end are hesitant to assume large mortgages when interest rates are expected to rise within the next several years?
Thank you for the great info.
Seattle Stucco
Post a Comment