Sunday, March 31, 2013

Regional Data

Mo data mo problems.

Today's update comes courtesy of HHV contributor Koozdra, who decided to liberate the complete monthly data out of the confines of the PDF format from VREB's excellent historical archive.  For those who are interested in the technical process, Koozdra explains here.


In short, we now have the monthly sales numbers, volume, average price, 6 month average price and median price for each housing type and each region back to 2006.

Here are some basic charts of the median prices for the various areas.  Note that even after a 3 month averaging window, the data is quite noisy due to few sales per region.  The regions with extremely low sales have been left out (Vic West, View Royal, Metchosin, Highlands, etc).


Oak Bay gets its own graph since it flattens the rest.  Again few sales make the data very noisy.

Langford and Colwood have been relatively hard hit.  Interesting how flat Sooke is though.  Maybe the credit restrictions have more effect in the younger communities?


Download the raw data here (right click, save as).

Monday, March 25, 2013

Mar 25 Market Update

MLS numbers update courtesy of the VREB via Marko Juras. These numbers are for the Victoria Real Estate Board's reporting area, including Sooke, Shawnigan Lake and the Gulf Islands.

March 2013March 2012 
Wk 1Wk 2Wk 3Wk 4
Uncond. Sales150
259
382
570
New Listings433
732
980
1385
Active Listings4137
4215
4267
 4274
Sales to New Listings
 34%
35%
39%
 41%
Sales Projection500
470
478
Months of Inventory
7.5

Sales are just failing to pick up like they should for the spring.   Again we are lagging on sales/list and with our increased inventory we will see continued high MOI at end of month (~9 vs last year's 7.5).

Wednesday, March 20, 2013

Monday, March 18, 2013

Market Update and a Glance at Equity

MLS numbers update courtesy of the VREB via Marko Juras. These numbers are for the Victoria Real Estate Board's reporting area, including Sooke, Shawnigan Lake and the Gulf Islands.

March 2013March 2012 
Wk 1Wk 2Wk 3Wk 4
Uncond. Sales150
259
570
New Listings433
732
1385
Active Listings4137
4215
 4274
Sales to New Listings
 34%
35%
 41%
Sales Projection500
470
Months of Inventory
7.5

Tracking extremely close to last year now with an identical sales rate and a couple more listings (sales/list last year this time was 37%).  If this spring is to stabilize the market somewhat then sales will have to pick up significantly.

On the topic of equity, here is the situation for home owners in Canada according to StatsCan.

Meanwhile, here is what happened to house prices.

Interesting how equity increased along with house prices from 2000 to Q1 2007 and then took a nosedive.    That is right around the time when CMHC opened the mortgage taps and started to fire up the market with a stream of new buyers that had previously been priced out.   Take a look at the mortgage changes that led up to this decline in equity, courtesy of Saskatoon Housing Bubble.

Mar 2006 – CMHC: 0% down, 30 yr amortizations (Genworth announces 35 yr amortizations)
Jun 2006 – CMHC: 0% down, 35 yr amortizations, interest only payments allowed for 10 years
Nov 2006 – CMHC: 0% down, 40 yr amortizations, interest only payments allowed for 10 years

The flat period after 2003 also perfectly lines up with the introduction of 5% down for everyone and the removal of CMHC price ceilings.

Thursday, March 14, 2013

Time for some feedback

Unless you've been living under the proverbial rock, you'll know what to do here...


I want to see this on HHV
  
pollcode.com free polls 

Monday, March 11, 2013

March 11 Market Update

MLS numbers update courtesy of the VREB via Marko Juras. These numbers are for the Victoria Real Estate Board's reporting area, including Sooke, Shawnigan Lake and the Gulf Islands.

March 2013March 2012 
Wk 1Wk 2Wk 3Wk 4
Uncond. Sales150

570
New Listings433
1385
Active Listings4137
 4274
Sales to New Listings
 34%
 41%
Sales Projection500
Months of Inventory
7.5

Relatively strong start to the month. Last year at this point we were running at 21.7 sales and 66 listings per business day, while so far this year we are seeing 25 sales and 72 listings.  Still 300 more active listings out there than the same time last year.

Wednesday, March 6, 2013

200 comment update

Thanks to DavidL for the chart showing the relationship between averages and medians over the past 8 Februarys.  Of course it is but a single data point that diverges, but it is remarkable the consistency of previous years.


Made me think about whether there is some kind of pattern there so I plotted monthly data for the last 22 years.   Is there a pattern?  Dunno.  Might deserve some closer examination.  More importantly we can all stop clicking that annoying "Newer" link.


Saturday, March 2, 2013

Projections

Subtitle:  Towards a better different sales projection algorithm

A couple weeks ago there was some talk about sales projections, and whether it was better to project monthly sales based on business days or days of the month.   I've used business days before just because I've seen it used elsewhere, but DavidL made the point that sales will happen on any day, and it really doesn't matter whether they get entered on Sunday or Monday (unless the month ends on a weekend).

However both methods have a fundamental shortcoming which is that they assume a constant market. Both methods project the sales rate of the month to date out to the full month, which only works when the sales rate is more or less constant and there is no such thing as seasonality.  This leads to chronic underestimation of sales when the market is heating up in the spring, and overestimation when it is cooling down in the fall.  The projections for last month illustrate this quite well:

Feb 2013 Feb 2012
Wk 1 Wk 2 Wk 3 Wk 4
Uncond. Sales
19
121
209
322
497
New Listings
104
405
632
889
1318
Active Listings
3786
3886
3964
4031
3977
Sales to New Listings
18%
30%
33%
36%
38%
Sales Projection
--
338
344
376
Months of Inventory
8.0

The final sales for Feb 2013 came to 394.  We can see that halfway through the month our simple linear projection was still off by 50 sales, or 12.6%.   An attempt to make a prediction at the start of the month would have been even worse.  Hence the need for a new model that tries to take into account the rate of change in the sales rate for the current month to improve the projection.

First we have to estimate how the sales rate will change from the previous month to the current one.  To do this, I look at data from the previous year.  For example, in Jan 2012 we had 372 sales, for a sales rate of 12 sales/day, while Feb 2012 yielded 497 or 17.1 per day.  Assuming that this year will behave similarly to last year, we can use a linear approximation to estimate the sales rate on a given day.


Where y is our expected sales rate on day x, a is the slope calculated from last year's data (0.17 in this case), and b is the sales rate from Jan 2013.  Now that we have an equation for how the sales rate is expected to behave, all we have to do to calculate the projected sales is integrate over the month of February.  In case anyone is interested, here's the VBA code.

Using this method, the prediction for this month would have been 407 sales, or only 3% off the actual number.

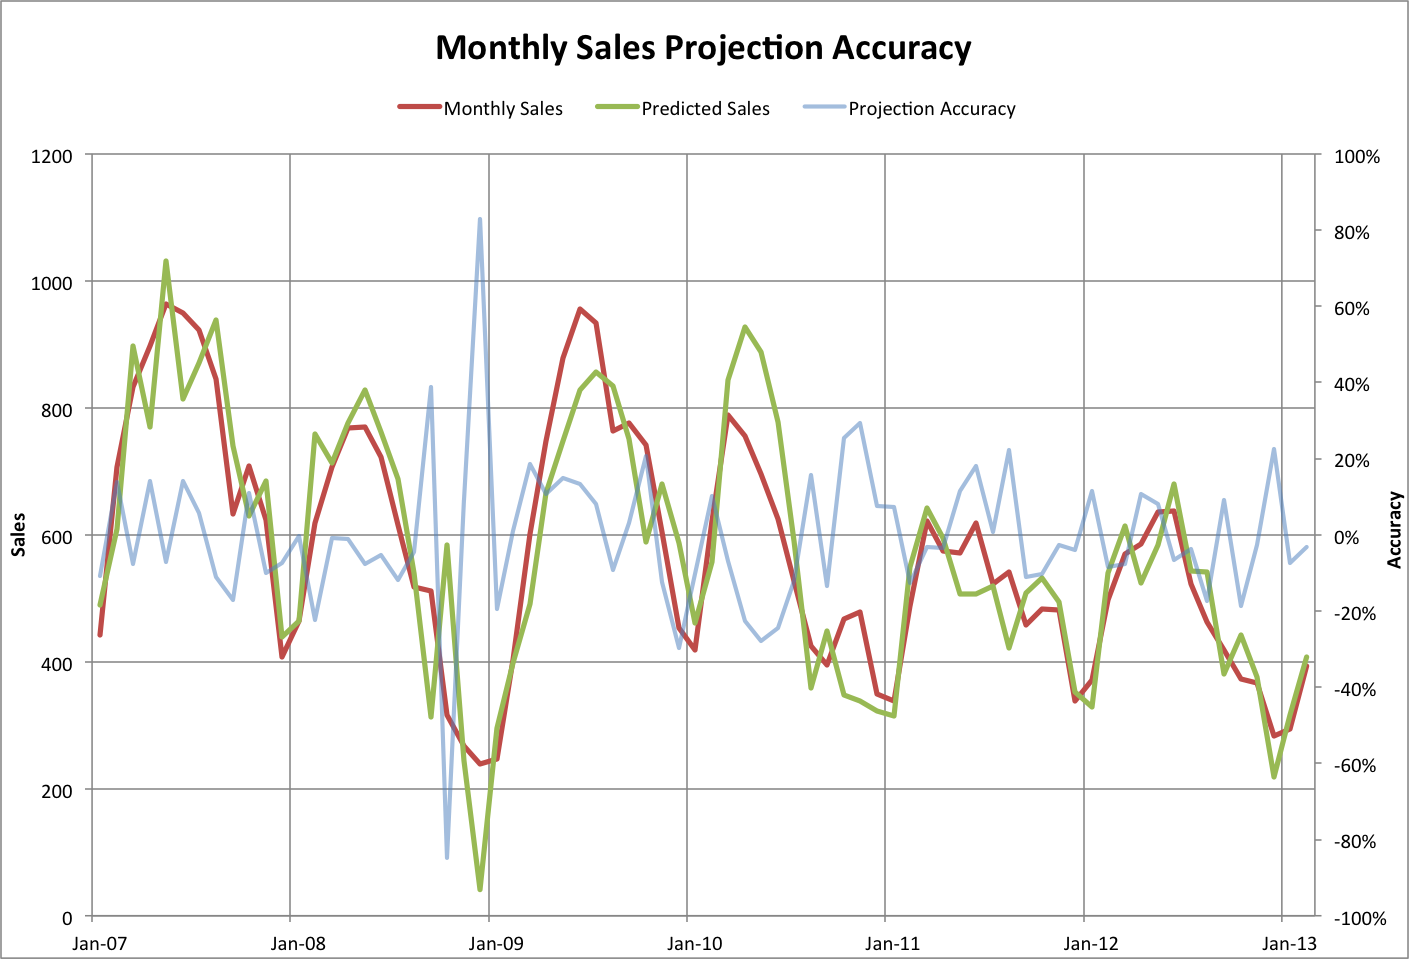
Of course the key assumption is that the market will behave similarly to last year's.  This happens to have worked out well for February 2013, but can work out quite spectacularly badly during times when the market is shifting.  Let's have a look at the accuracy of the predictions using this method over the last few years.


The model does well when the market is stable year over year, and extremely poorly when the market is unstable, or was unstable in the previous year (fall 2008 being the obvious example).   The market has been relatively stable (read: boring) for a while now, and I expect that will continue.  To improve the model, one could add another component of the current market conditions, such as the mid-month numbers.

So, how many sales can we expect this month?  Computer says 474.

Friday, March 1, 2013

February Decline-o-meter

What will be blamed for this month's sales?   Too few days?  The rainy weather?  The sunny weather?  The wind?  A new stat holiday?   I'm still waiting for an honourable mention for this blog as a possible cause.

Thanks to Marko for the early update:
February 2013 
Net Unconditional Sales: 394 
New Listings: 1,039 
Active Listings: 4,072  
Sales down 20.7%, new listings down 21.2% 
SFH Median = $517,500
SFH Average = $601,377

Condo Median = $270,000

Condo Average = $299,412
 
We'll update with the official VREB numbers when those come out.

In the meantime, here's a new graph.  Thanks to our local gal Info for the idea.


UPDATE:

The VREB release is out and it's a doozy.

They lead with an amazing 34% increase in sales from January.  Truly a testament to the strength of this market when February sales are higher than January.  That normally never happens.  They like this theory so much they use the rest of the release to restate it in various forms.  

To be fair, they do go on to comparing year over year, where for the second month their calculator is on the fritz, pegging the sales decline at 18.26% rather than the actual 20.7%.  

I think if there's one positive thing in this February's numbers, it's the listings falling short of last year.  If that continues the market might retreat from the current strong buyers market to something closer to what we've seen the past two years.